Scope creep: from simple map to interactive experience
I wanted one simple thing: a map of where my photos were taken. One pin per location, no clutter, and no surprise API bills.
This was supposed to be a short build note, not a deep dive. Then the implementation stopped being small.
What began as a quiet photo map picked up just enough real product weight to become interesting: clustered markers, preview popups, travel pins, search, shareable URLs, stats, fullscreen, and all the fiddly state management those imply.
Constraints first, aesthetics second
The rules were clear:
- No paid map services
- Build-time geocoding1 so deploys stay deterministic2
- Cache everything to avoid repeated lookups
- One pin per unique location, even if there are ten photos from the same place
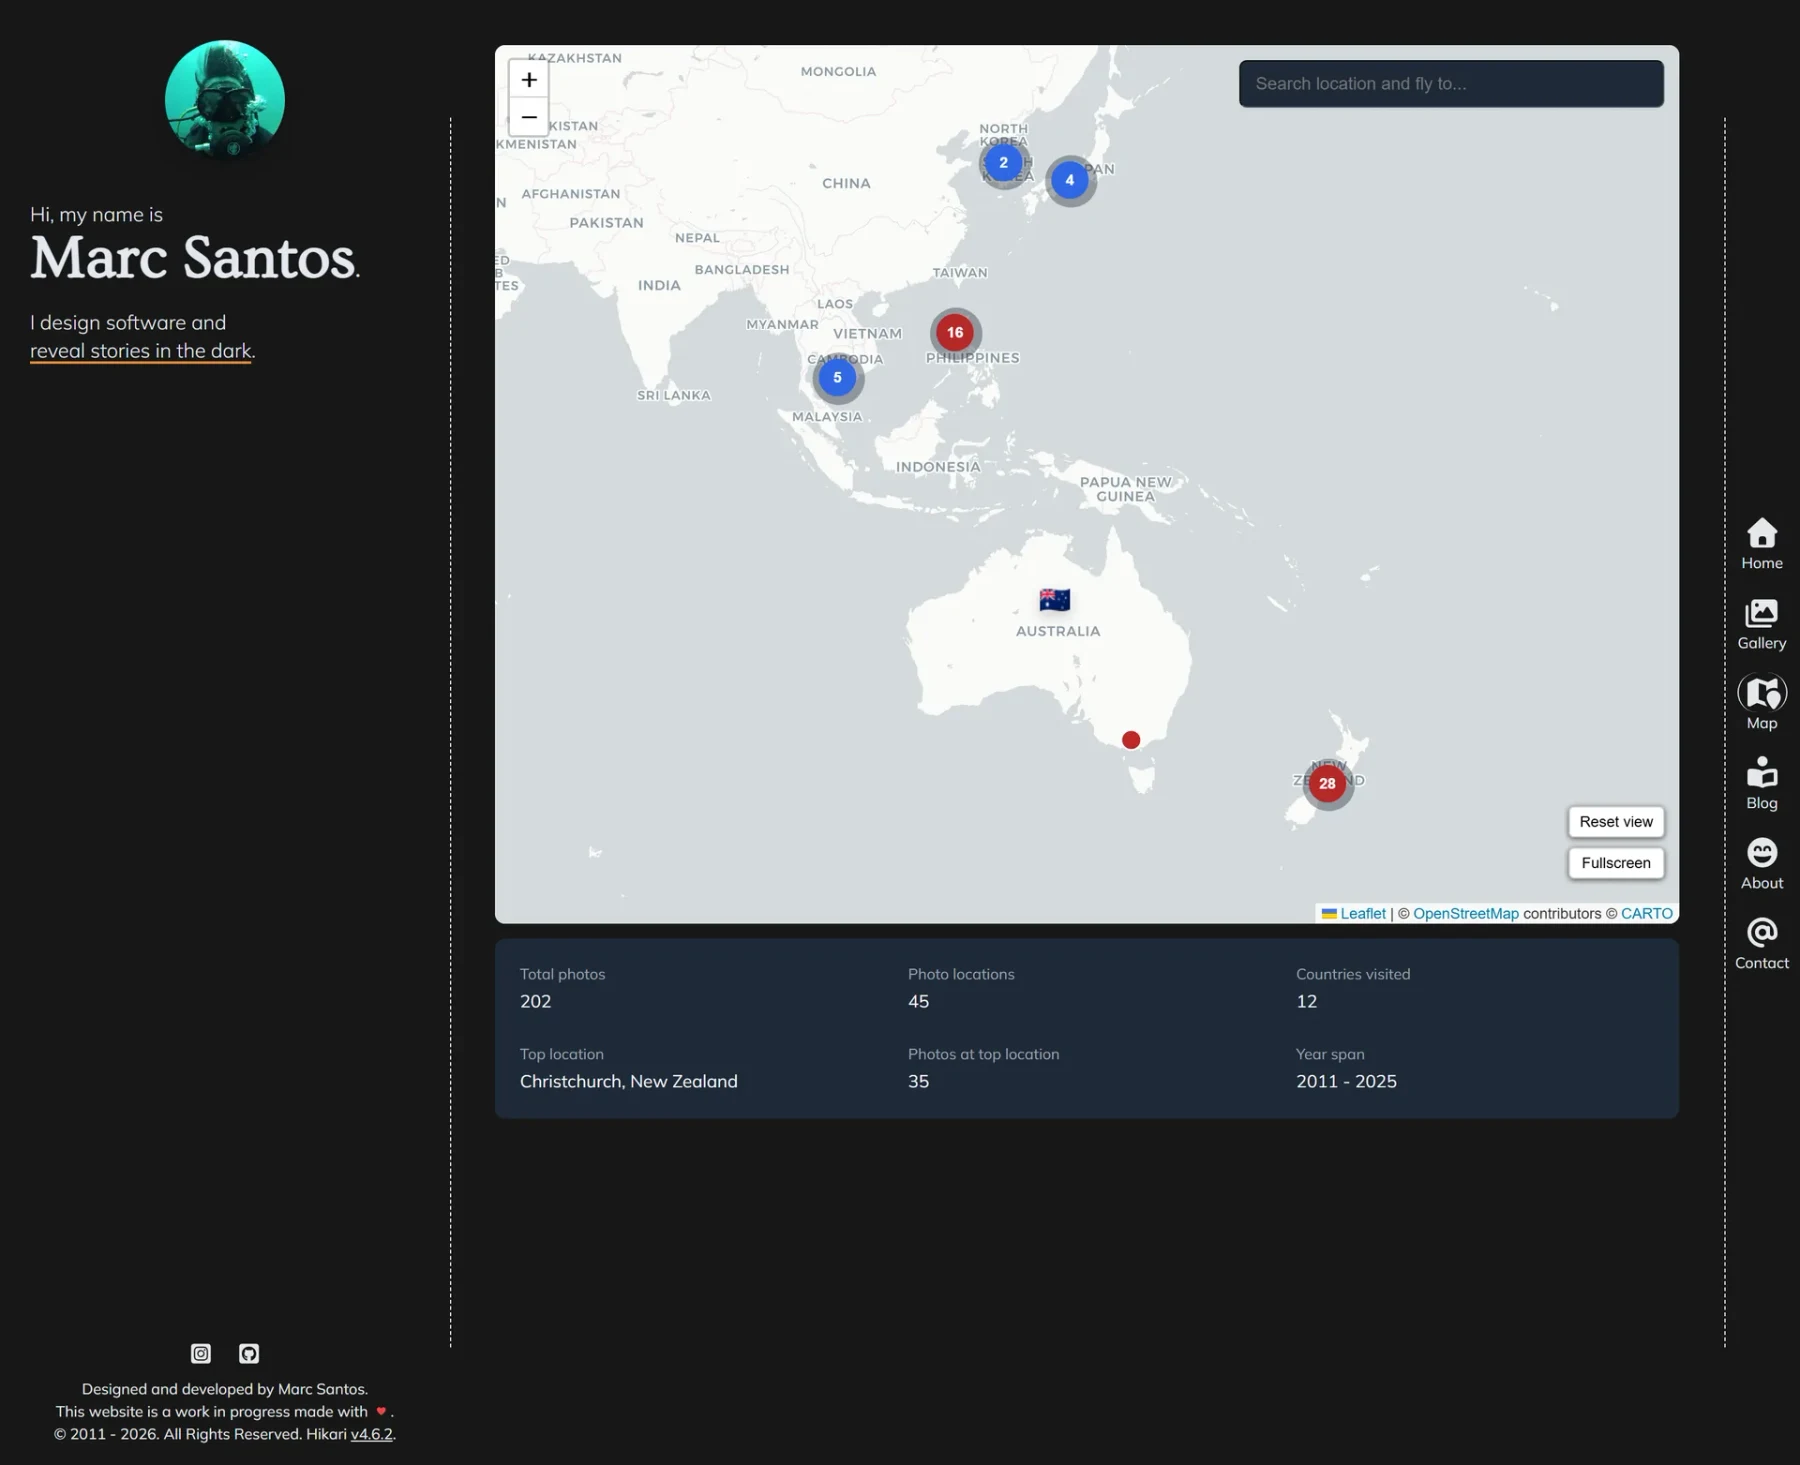
- Play nice with the site theme toggle
I picked Leaflet because it is reliable, boring in the best way, and does not care that this site is on React 19. That compatibility issue was the trigger, but Leaflet also made the rest of the requirements feel easy: simple tile swaps, no React wrapper churn, and predictable marker tooling. I then switched tiles to Carto so I could have light and dark styles without an API key3.
The data flow
Every pin starts in data/site/captions.json.
[
  {
    "filename": "0087.webp",
    "caption": "Devils Punchbowl Falls, New Zealand",
    "date": "2021 07",
    "location": "Devils Punchbowl Falls, Arthur's Pass, New Zealand",
    "tags": ["landscape"]
  },
  {
    "filename": "0088.webp",
    "caption": "Ben Ohau, New Zealand",
    "date": "2021 12",
    "location": "Ben Ohau, New Zealand",
    "tags": ["landscape"]
  }
]
At build time, a small script:
- Reads all unique
locationvalues - Geocodes them with Nominatim (OpenStreetMap)
- Rounds coordinates for privacy and readability
- Saves results in
data/site/location-coordinates.json
At the time this was written, it ran on every build via a Gatsby lifecycle hook:
const { syncLocationCoordinates } = require('./scripts/geocode-locations');

exports.onPreBootstrap = async ({ reporter }) => {
  await syncLocationCoordinates({ reporter });
};
From there, the /map page reads the cache and renders one marker per location.
Current-state drift note: the implementation later shifted away from wiring geocoding through that lifecycle hook, and now uses the dedicated npm run geocode:locations workflow when coordinates need to be refreshed.
The nice part is that the site can rebuild offline once the cache is primed. The less nice part is that typos and poetic location names do not geocode well.
A good example of what not to do:
Devils Punchbowl Walking Track, New Zealand
And the version that geocodes reliably:
Devils Punchbowl Falls, Arthur's Pass, New Zealand
Geocoding implementation
const collectLocations = (captions) => {
  const unique = new Set();
  captions.forEach((entry) => {
    if (typeof entry.location === 'string' && entry.location.trim()) {
      unique.add(entry.location.trim());
    }
  });
  return Array.from(unique).sort((a, b) => a.localeCompare(b));
};

const roundCoordinate = (value) => Number(Number.parseFloat(value).toFixed(2));
Rounding keeps the pins close enough for storytelling without sharing exact coordinates, and it keeps the cache lean.
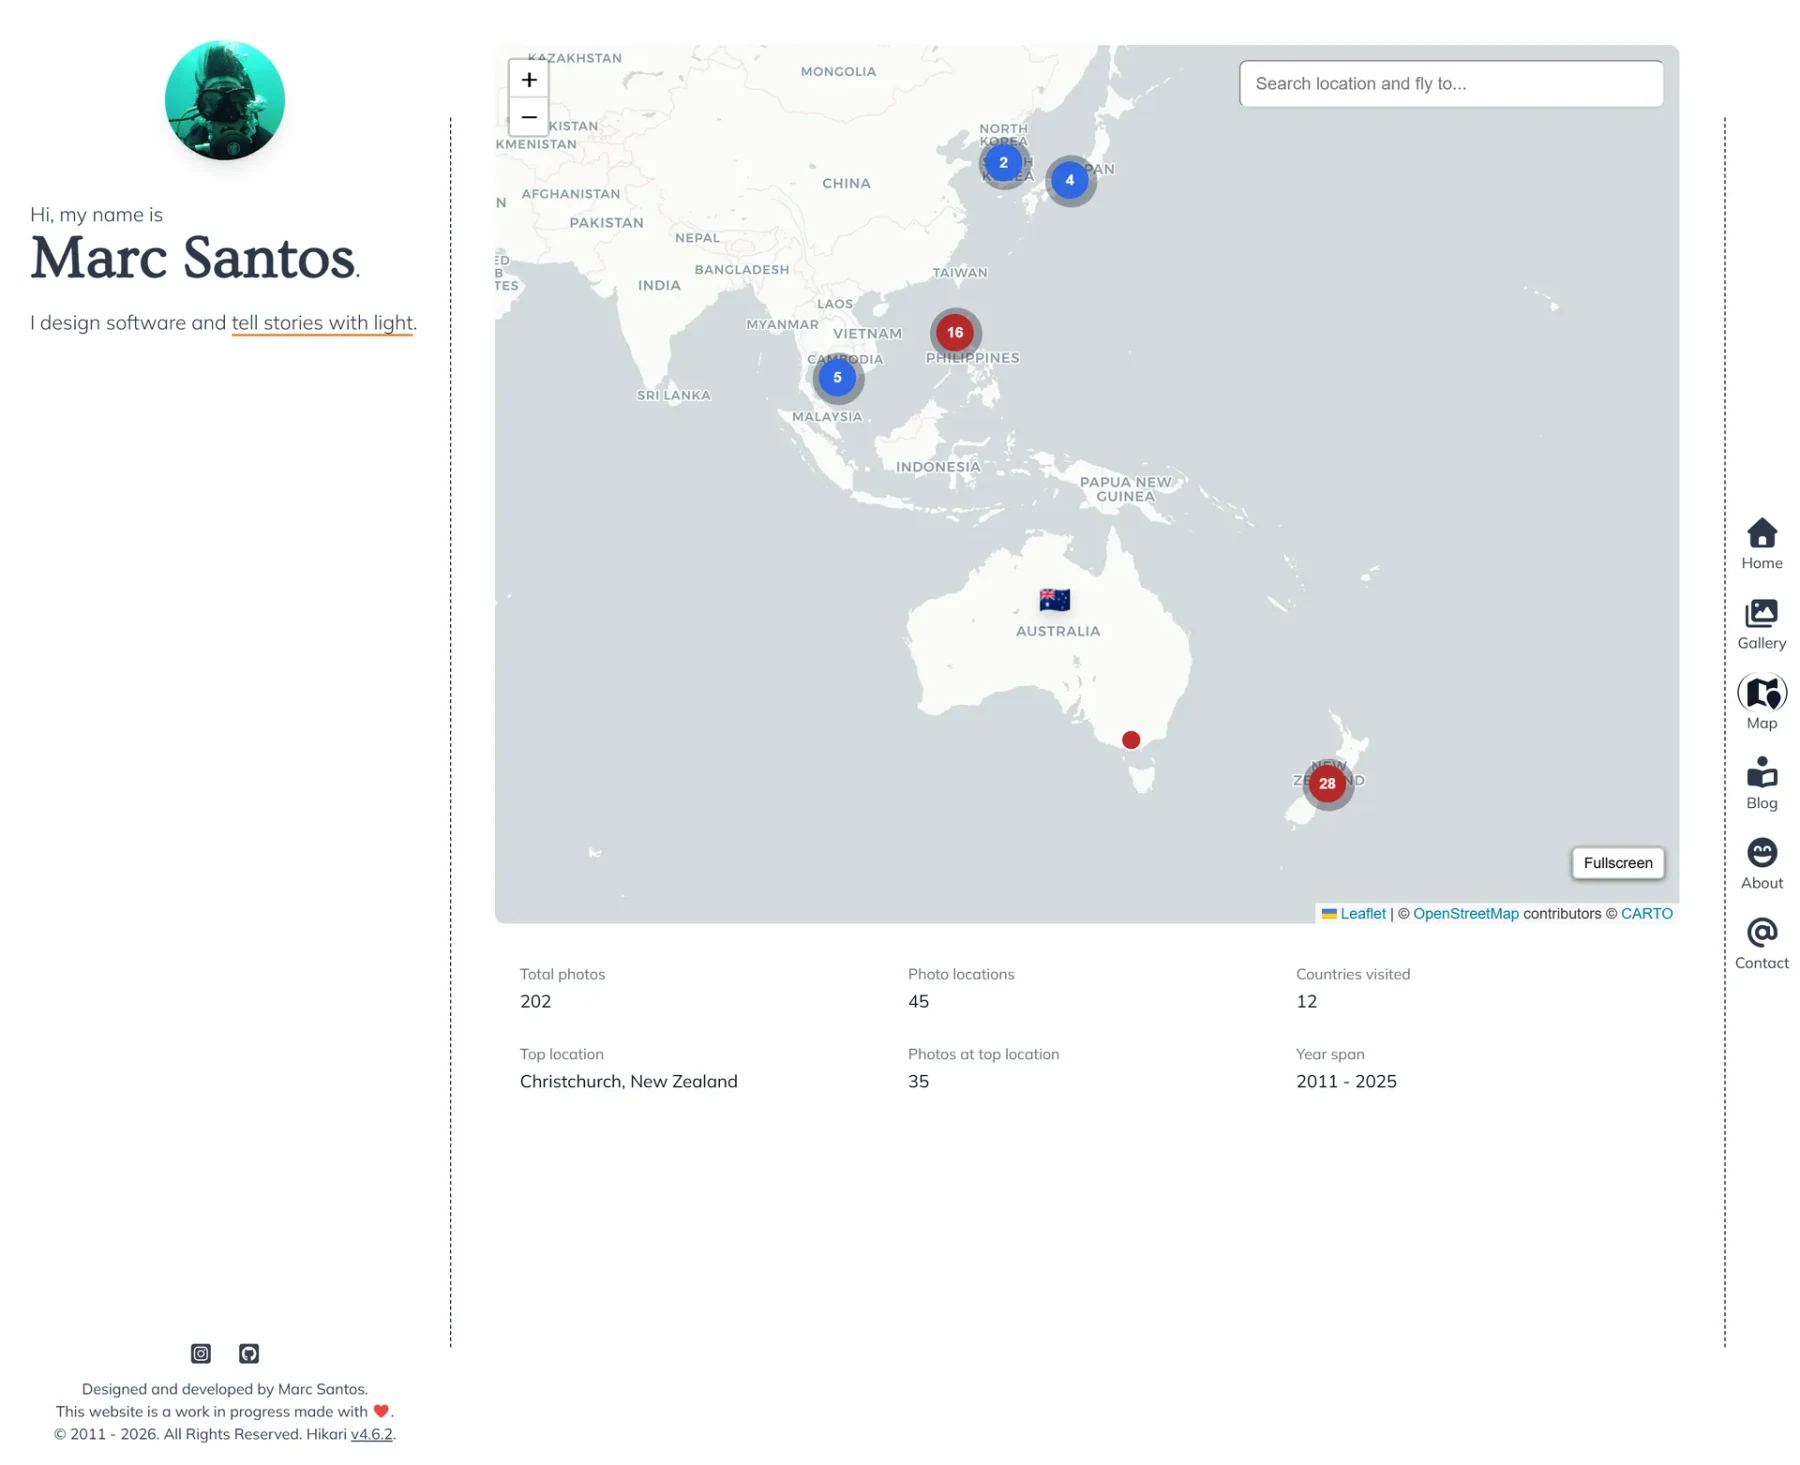
The map page
The map itself is intentionally quiet:
- Auto-fit bounds so the first view actually lands on the pins
- Search + fly-to for quickly jumping to any mapped location
- URL state persistence so view and selected marker can be shared
- A compact stats panel for totals, top location, and date span
- Fullscreen toggle for focused exploration
- Theme toggle swaps the tile style instantly without reloading
There is still no layer switcher — it is a photo map first, not a navigation app.


The map setup is small on purpose:
const lightTileLayer = L.tileLayer(CARTO_LIGHT_URL, { minZoom: 0, maxZoom: 22 });
const darkTileLayer = L.tileLayer(CARTO_DARK_URL, { minZoom: 0, maxZoom: 22 });

mapLocations.forEach((entry) => {
  const marker = L.circleMarker([entry.coordinates[1], entry.coordinates[0]], {
    radius: 6,
    color: '#ffffff',
    weight: 1.4,
    fillColor: '#b91c1c',
    fillOpacity: 0.95,
  });
  const photoLabel = entry.photoCount === 1 ? 'photo' : 'photos';
  marker.bindPopup(`${entry.location} · ${entry.photoCount} ${photoLabel}`);
  marker.addTo(map);
});
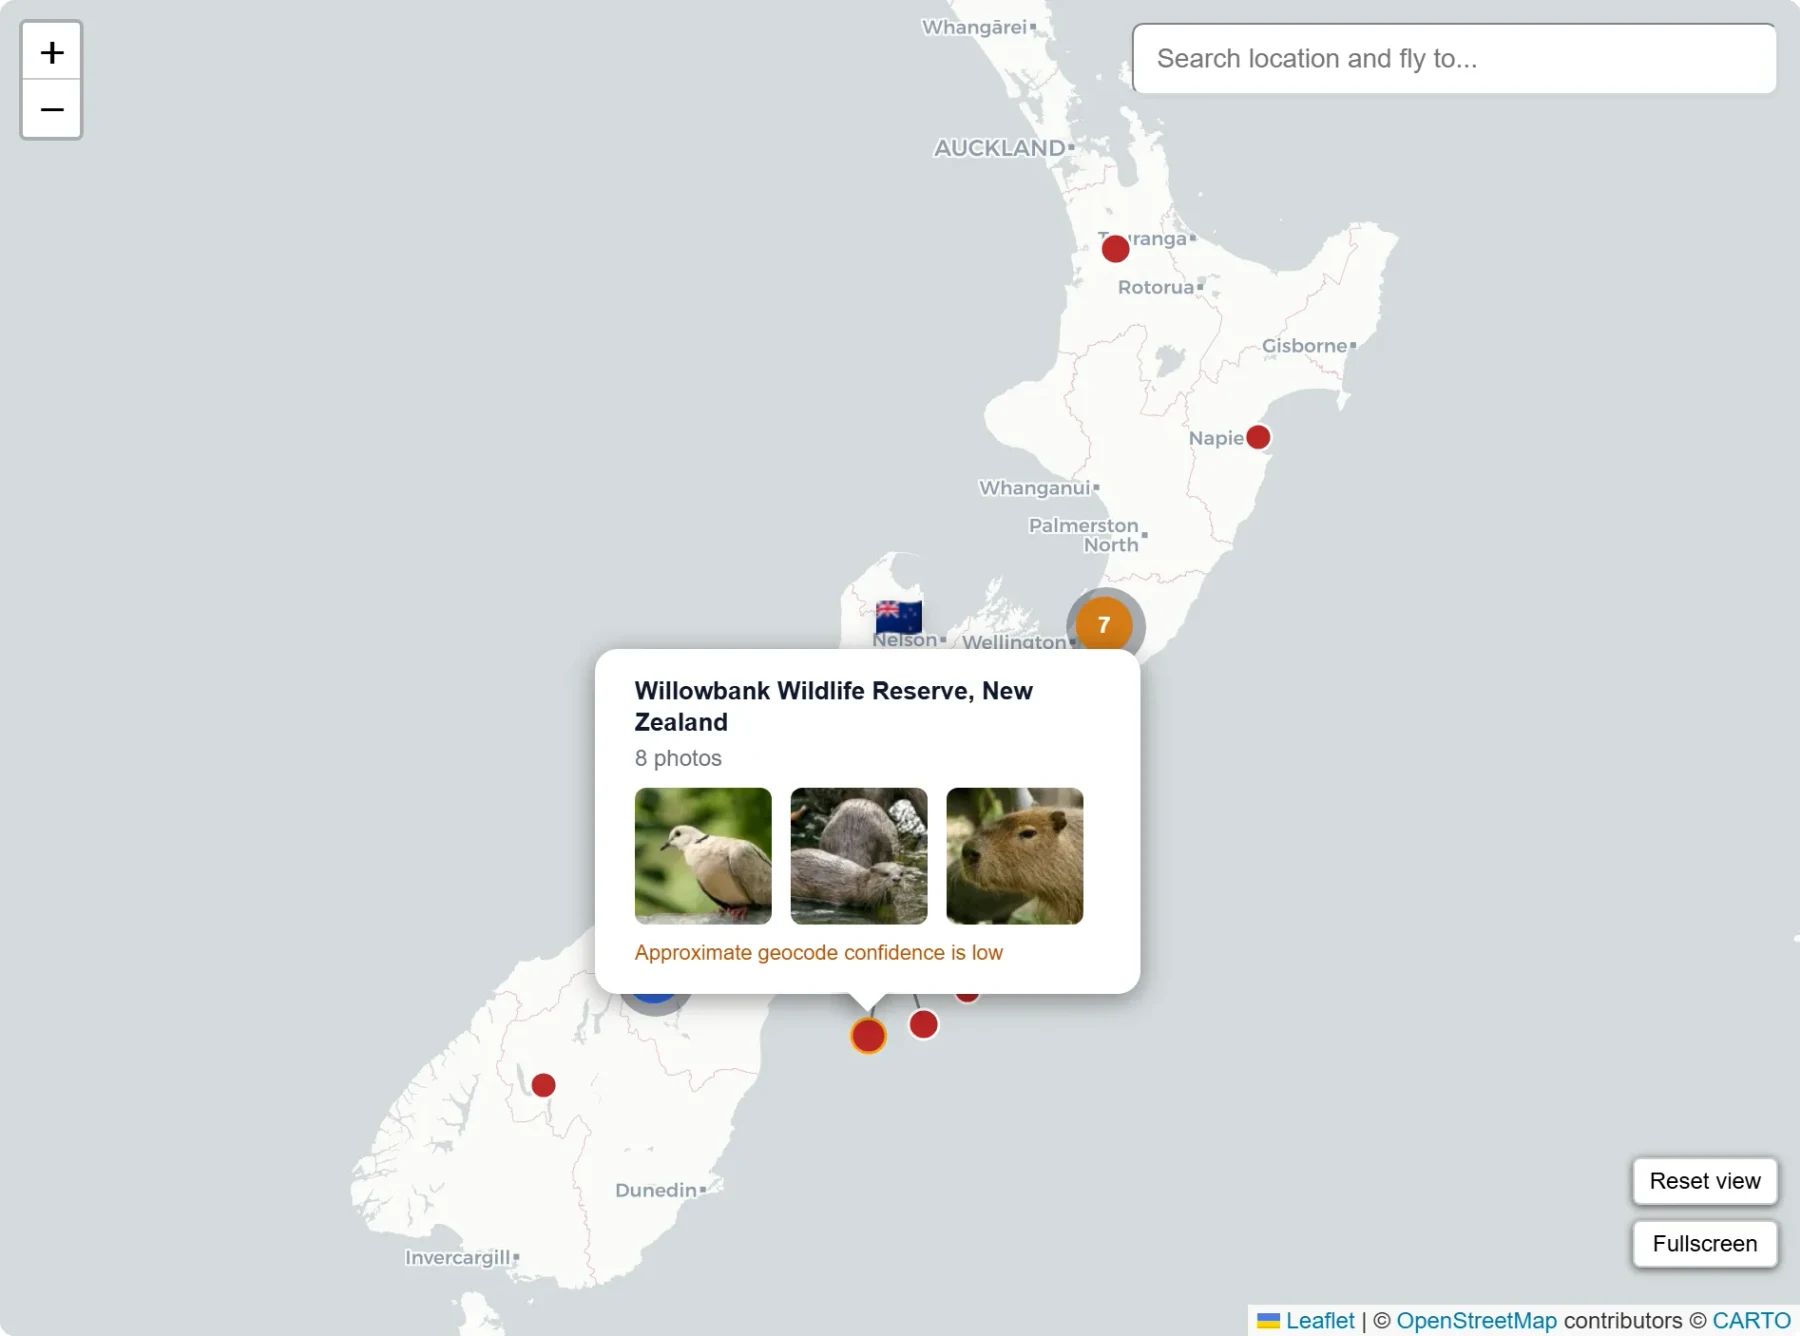
In practice, popups are richer than this snippet: they include a location title, count metadata, up to 3 photo previews, and a low-confidence note when applicable.
Marker clustering
To prevent visual clutter when multiple locations cluster together, the map uses leaflet.markercluster to automatically group nearby pins.
Clusters are color-coded by density: blue for small groups (<6), amber for medium (6–15), red for dense zones (16+). As you zoom in, clusters split and expand via spiderfying4. Clean and legible.
Overlapping pin handling
Some locations have identical rounded coordinates (shared GPS points). Instead of hiding them, overlapping markers spread in rings: 8 per ring, then expanding outward at ~560m distance each.
The algorithm is deterministic — no randomness. Pin order is always the same.
const spreadOverlappingLocations = (locations) => {
  const grouped = new Map();
  locations.forEach((entry) => {
    const key = `${entry.coordinates[1]}:${entry.coordinates[0]}`;
    const existing = grouped.get(key) || [];
    existing.push(entry);
    grouped.set(key, existing);
  });

  const spread = [];
  grouped.forEach((group) => {
    if (group.length === 1) {
      spread.push(group[0]);
      return;
    }

    group.forEach((entry, index) => {
      const ring = Math.floor(index / 8) + 1;
      const indexInRing = index % 8;
      const angle = (indexInRing / 8) * Math.PI * 2;
      const offset = ring * 0.005; // ~560m per ring

      spread.push({
        ...entry,
        coordinates: [
          entry.coordinates[0] + Math.cos(angle) * offset,
          entry.coordinates[1] + Math.sin(angle) * offset,
        ],
        hasAdjustedPosition: true,
      });
    });
  });
  return spread;
};
Mobile & keyboard interaction
Touch devices can't hover. Markers listen for tap-to-open on mobile, and Enter/Space on desktop. Escape closes popups. Tab through markers like you would any button.
Device detection: window.matchMedia('(hover: none), (pointer: coarse)').
Photo preview popups
Hover a marker and see a 3-image grid from that location along with the location name and photo count. The grid is drawn from Gatsby Sharp transforms, so images are optimized WebP.


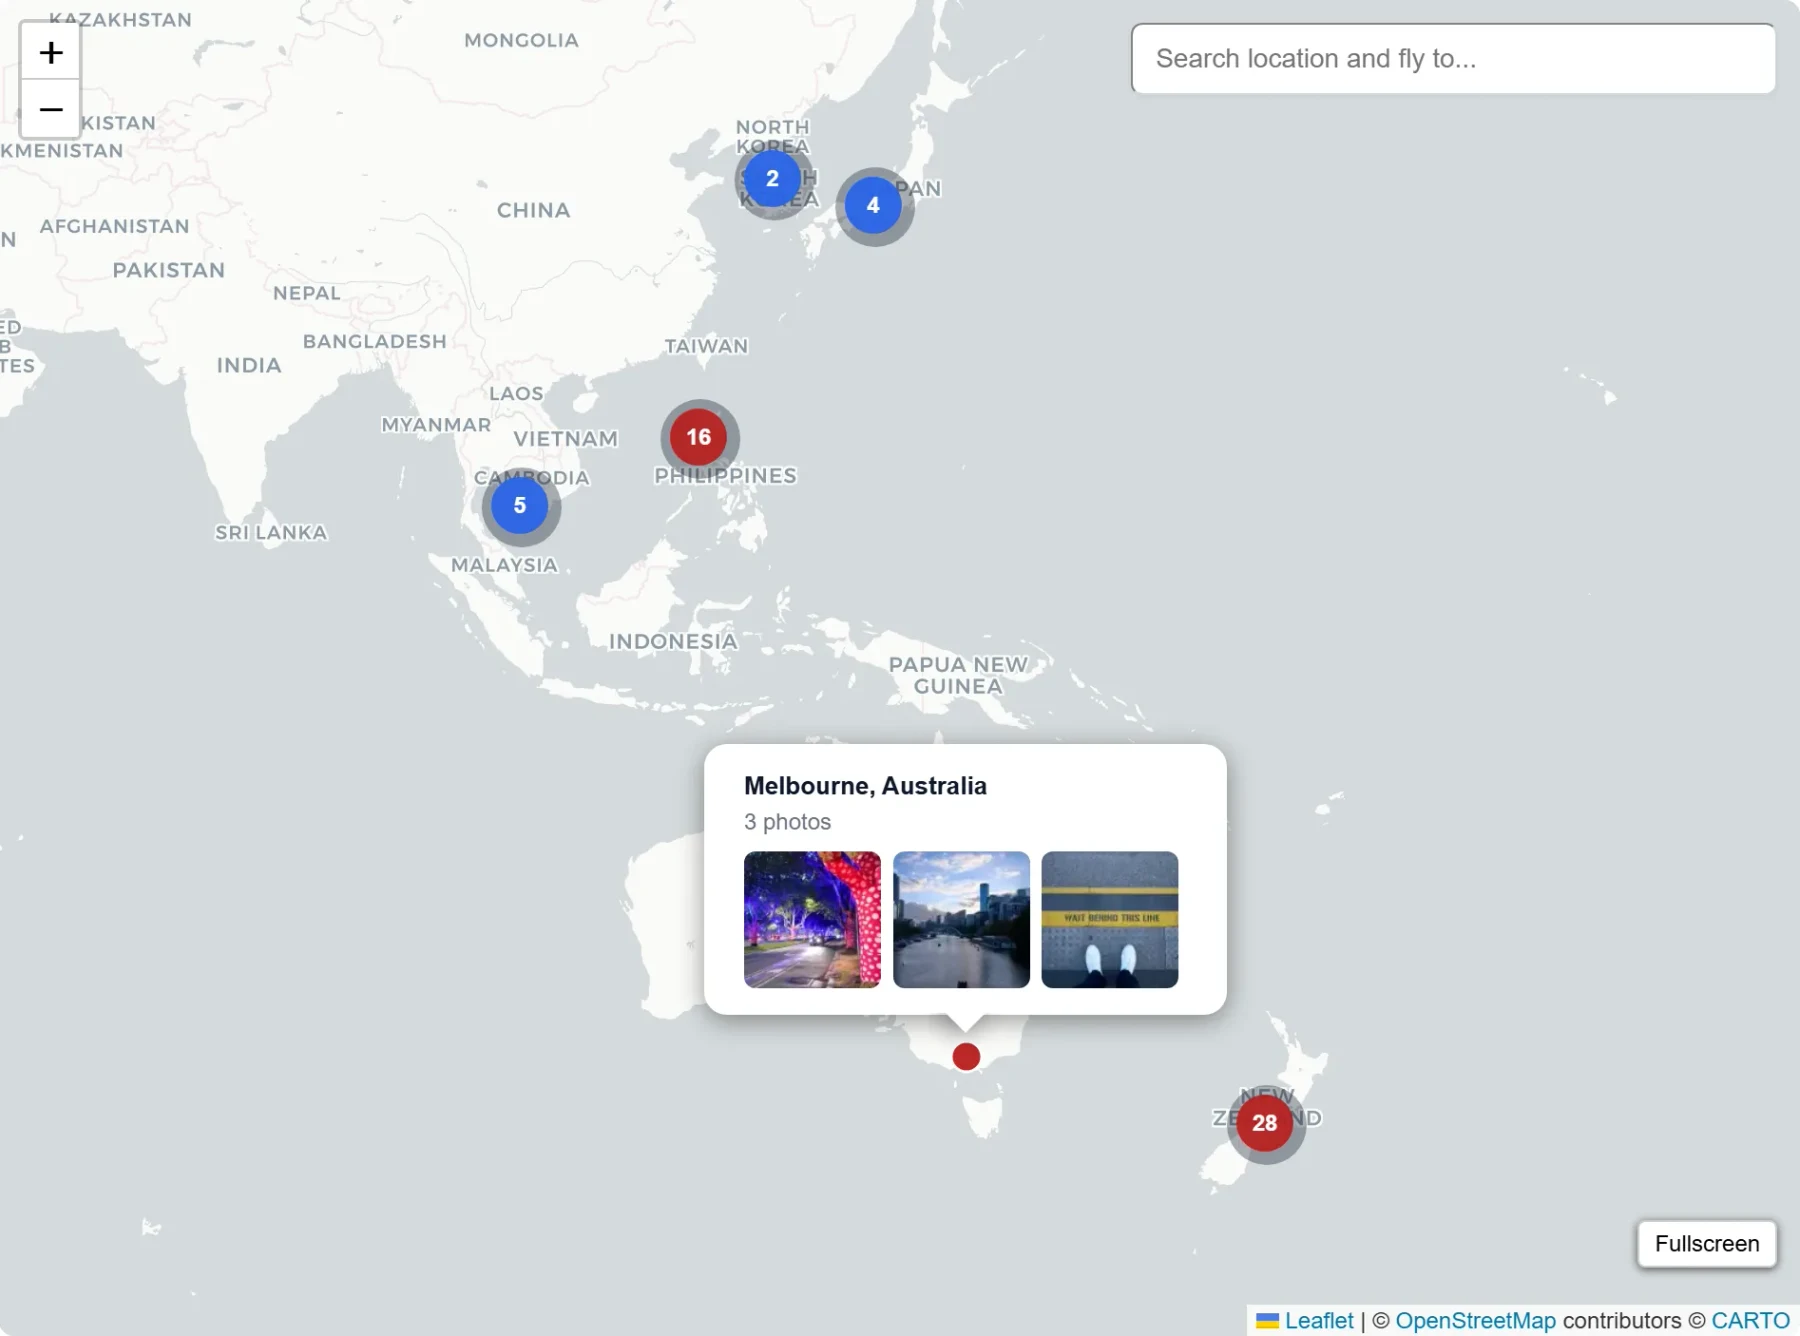
Low-confidence geocodes show an orange note below the grid: "Approximate geocode confidence is low".
Travel pins + flags
The map merges in countries from travel.json. Those pins render as small flag icons and the popup shows a visit count rather than photo previews.
Search + URL state
Search sits at the top-right of the map with keyboard navigation (ArrowUp, ArrowDown, Enter, Escape) and a mobile collapse toggle.

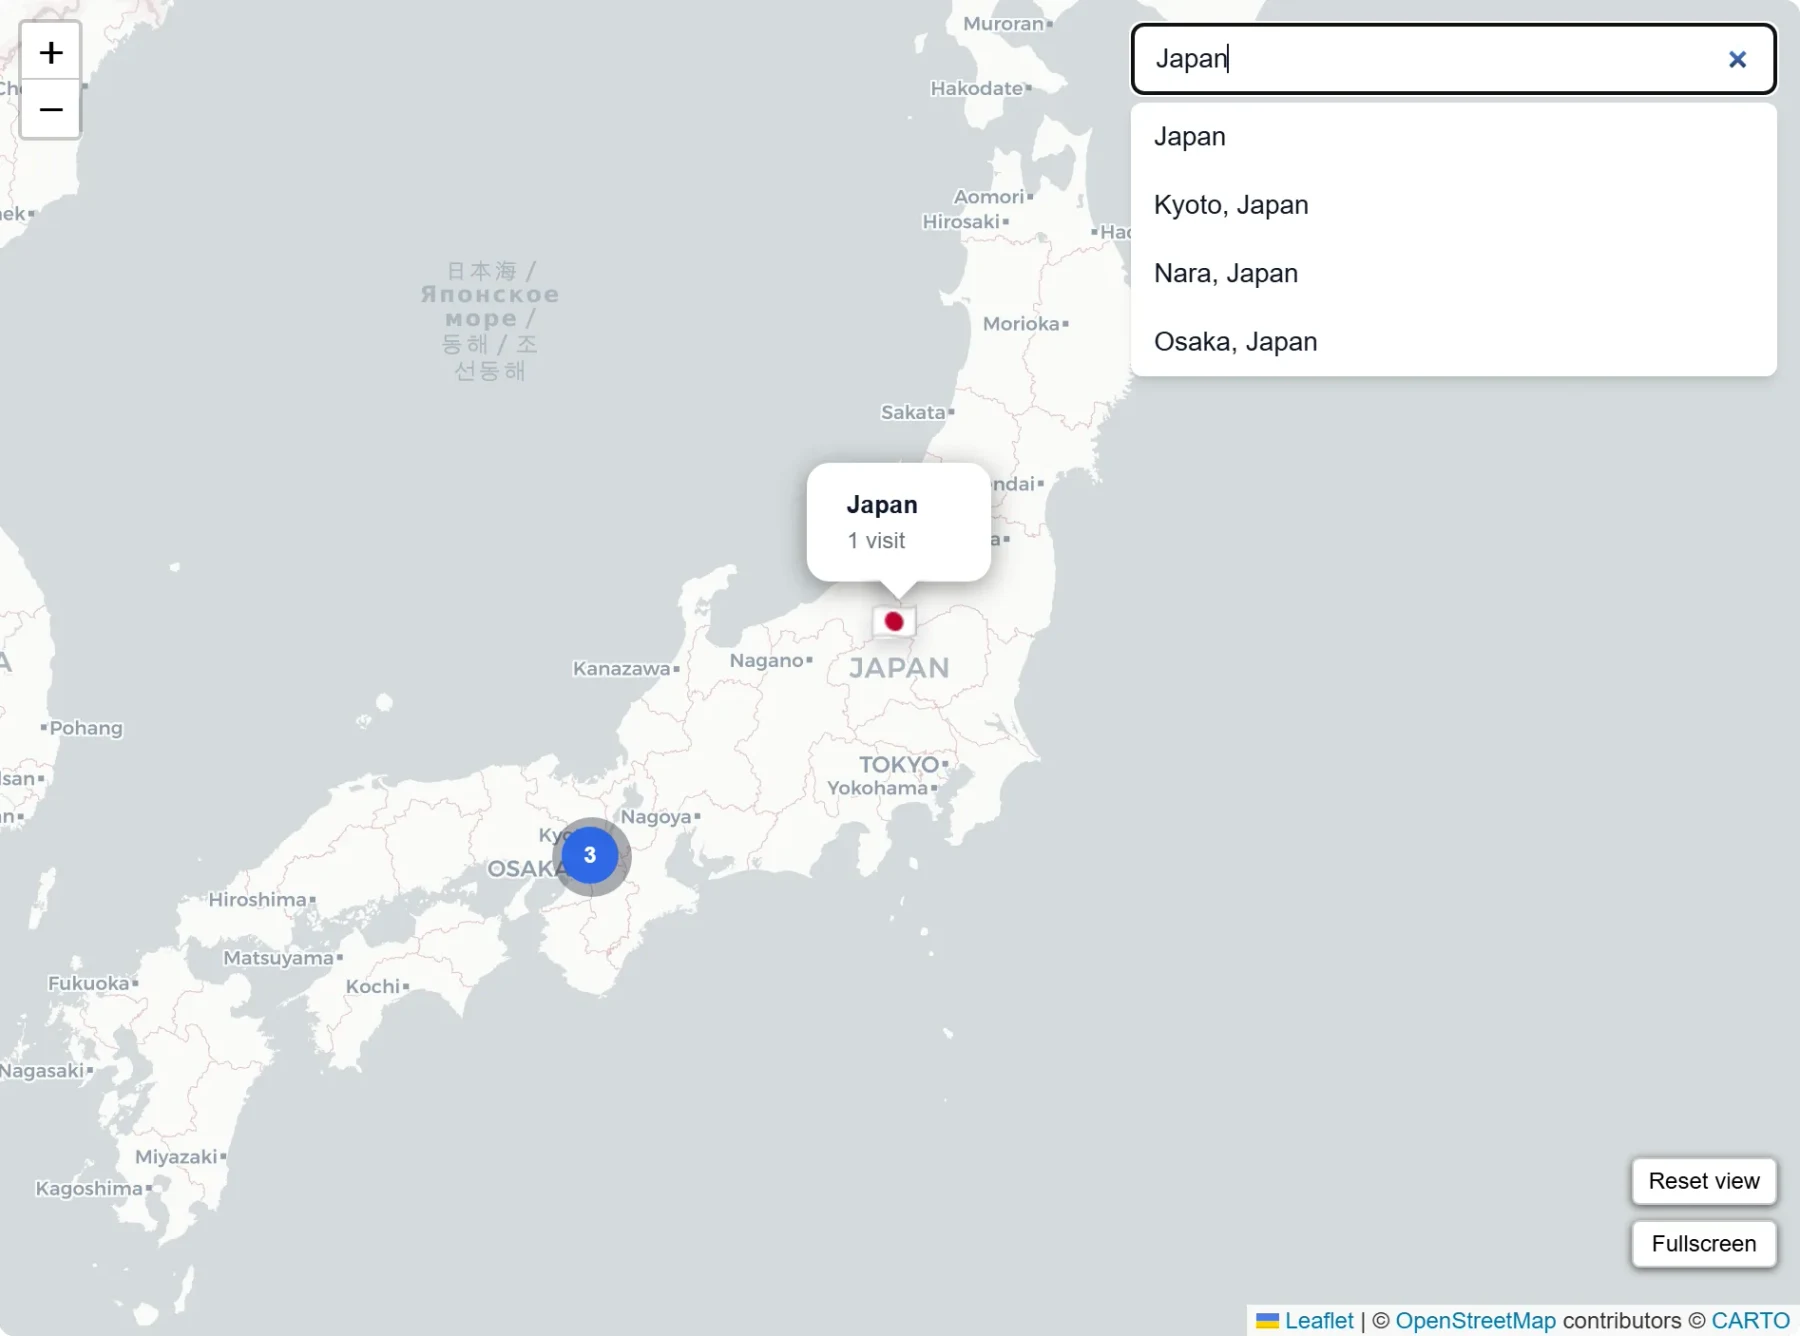
Selecting a result flies the map to the location and opens its marker popup. Map position and zoom are reflected in URL params (lat, lng, z), and opening a marker sets marker for shareable deep links.
Reset view
A lightweight reset button appears only after you pan or zoom away from the initial fit. It resets map bounds and search UI state, then hides itself once the view matches.
Stats + fullscreen
The map includes a stats panel below it (total photos, photo locations, countries visited, top location, and year span, plus pending geocode counts when relevant).
A fullscreen toggle in the map controls also expands the view for focused browsing.
Geocode confidence metadata
Nominatim's responses include importance and place_rank fields. Each geocode is classified as high/medium/low/unknown confidence based on those values:
- High:
importance >= 0.55orplace_rank >= 16(cities, landmarks) - Medium:
importance >= 0.25orplace_rank >= 10(towns, regions) - Low: Everything else (small villages, ambiguous names)
- Unknown: Missing data
Low-confidence pins get an orange border and the popup note mentioned above.

Performance: memoization
Popup HTML and ARIA labels5 are pre-computed once per page load (memoized6 via useMemo), not per marker. Device detection is also cached once.
Small wins: the map goes from blank to interactive faster.
The parts that surprised me
Two things caught me off guard:
- Cache drift. When a caption changes, the cache can keep old keys. I now prune the cache to match current captions on every geocoding run.
- Paid maps everywhere. Many elegant tile styles come with usage limits or require an API key. It is easy to forget that until you are already deep in the feature.
How to refresh locations
If captions change, I refresh the cache with:
npm run geocode:locations
If the map says a location is waiting for geocoding, it almost always means the location text in captions.json needs to be more specific, not more poetic.
Because locations are cached, the map stays fast in production even as the archive grows.
Closing thought
The map is a tiny system with real moving parts: data hygiene, caching, build hooks, theme sync, clustering, overlap handling, and accessibility.
What started as "one pin per location" became a fuller interface: marker clustering for dense zones, overlap spreading to prevent hidden pins, mobile and keyboard interaction patterns, photo preview popups, travel pins with country icons, shareable map state, search, stats, fullscreen, confidence classification from geocoding metadata, and a few performance optimizations to keep it feeling light.
It is still a map, but it is also a reminder that the smallest features can become the most instructive.
The roadmap still has room for a few additions when the time is right:
- A gallery drawer showing all photos from a selected location
- Timeline/date filtering for browsing by period
- Tag-based filtering for map exploration
Until then, the map stays calm, fast, and useful. You can see the result at /map.
Footnotes
-
Geocoding is the process of converting a place name or address into map coordinates (latitude/longitude). ↩
-
Deterministic builds produce the same output from the same input data, which makes deploys more predictable. ↩
-
Carto's basemap tiles are free to use with attribution; the credit line needs to remain visible. https://carto.com/attributions ↩
-
Spiderfying is the map behavior that fans overlapping markers outward so each one can be clicked individually. ↩
-
ARIA labels are accessibility text used by assistive technologies (such as screen readers) to describe interactive elements. ↩
-
Memoized means a computed result is cached and reused instead of recalculated on every render. ↩